Welcome to the wild and wonderful world of marketing analytics, where data reigns supreme and insights are the currency of success!
But hey, who said data analysis has to be dull?
Get ready to buckle up for a thrilling adventure as we introduce you to the vibrant and exhilarating realm of marketing analytics with Power BI. Think of it as a roller coaster ride, where we'll twist and turn through data, loop around insights, and zoom through visualization loops that will leave you screaming... with excitement!

So, fasten your seatbelts, hold on tight, and get ready to revolutionize your marketing analytics game with Power BI – the ultimate thrill ride for data-driven marketers!
Power BI, developed by Microsoft, is a powerful business intelligence tool that empowers you to transform raw data into valuable insights. It offers a comprehensive suite of features and capabilities designed specifically for data analysis and visualization.
With its intuitive interface and user-friendly design, Power BI enables marketers to gain a deep understanding of their marketing efforts, identify trends, and make informed decisions that drive business growth.
Learn how Power BI transforms your marketing analytics
Understanding the power of Power BI
Let's explore the fundamental concepts of Power BI and the immense power it brings to your marketing analytics endeavors. Power BI is built on the foundation of three core components: Power Query, Power Pivot, and Power View.
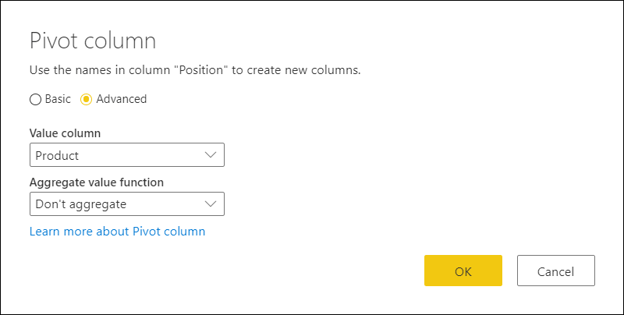
Power Query allows you to connect to various data sources, such as social media platforms, CRM systems, and web analytics tools, and extract the relevant data. It offers a user-friendly interface for data transformation and cleansing, enabling you to manipulate and shape the data to suit your analysis needs.


Source: Microsoft Power BI
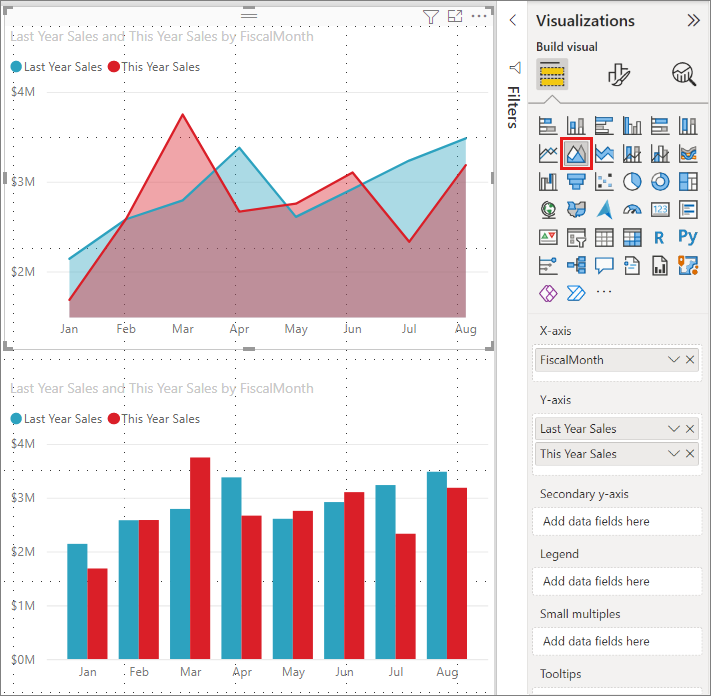
Power Pivot is a powerful data modeling tool that allows you to create relationships between different datasets, define calculated fields, and perform advanced calculations. It enables you to combine data from multiple sources and create a unified view of your marketing data, facilitating deeper insights and analysis.


Source: Microsoft Power BI
Power View is the visualization component of Power BI. It provides a range of interactive visualizations, including charts, graphs, maps, and tables, allowing you to present your marketing data in a visually appealing and easily understandable format. With Power View, you can create dynamic reports and dashboards that update in real-time, providing you with a holistic view of your marketing performance.

Source: Microsoft Power BI
Connecting and preparing your marketing data
Before you can harness the power of Power BI, you need to ensure your marketing data is properly connected and prepared. Power BI offers seamless integration with various data sources, allowing you to import data from sources such as Excel spreadsheets, SQL databases, and cloud-based platforms like Google Analytics and Salesforce.
Once your data is connected, Power BI provides intuitive data preparation capabilities. You can clean and transform your data by removing duplicates, fixing errors, and standardizing formats. Power Query's user-friendly interface simplifies the data preparation process, even for those with limited technical expertise.
Creating impactful visualizations
Data visualization is a key aspect of marketing analytics, as it helps you uncover patterns, trends, and insights within your data. Power BI offers a wide range of visualizations to suit your needs, from basic bar charts to advanced scatter plots and geographical maps.
With Power BI, you can customize and enhance your visualizations to create compelling and informative dashboards and reports. You can add interactive filters, drill-down capabilities, and slicers to allow for deeper exploration of your data. The drag-and-drop functionality of Power BI makes it easy to create amazing visualizations with no need for complex coding.
Analyzing your marketing performance
Power BI provides powerful analytical capabilities to help you gain valuable insights into your marketing performance. You can leverage features such as calculated measures, aggregations, and statistical functions to perform in-depth analysis and uncover actionable insights.
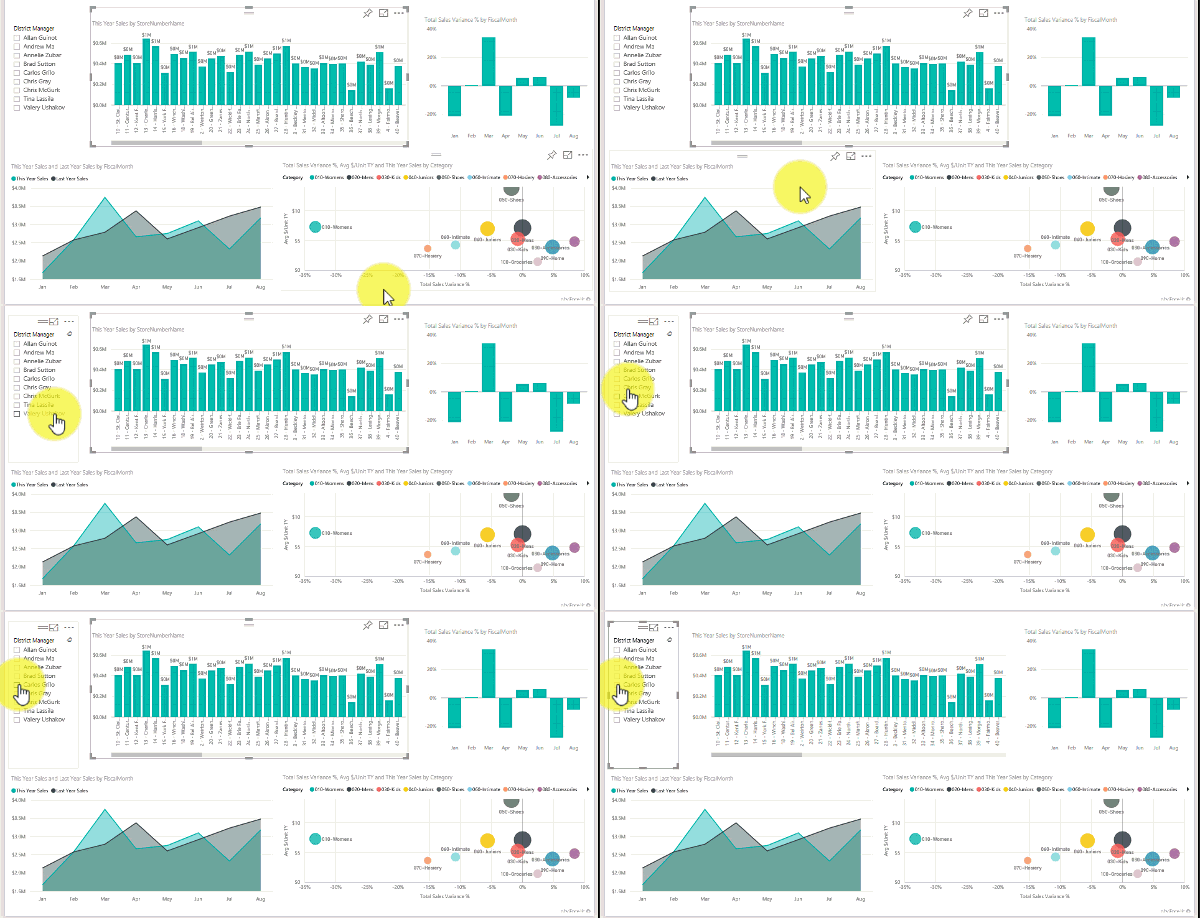
By tracking key marketing metrics, such as website traffic, conversion rates, and campaign performance, you can measure the effectiveness of your marketing initiatives and identify areas for improvement. Power BI's interactive capabilities allow you to slice and dice your data, enabling you to perform ad hoc analysis and answer specific business questions on the fly.

Source: Microsoft Power BI
Collaborating and sharing insights
Effective collaboration and knowledge sharing are essential for maximizing the impact of your marketing analytics efforts. Power BI provides robust collaboration features that allow you to share your insights with stakeholders and collaborate with your marketing team.
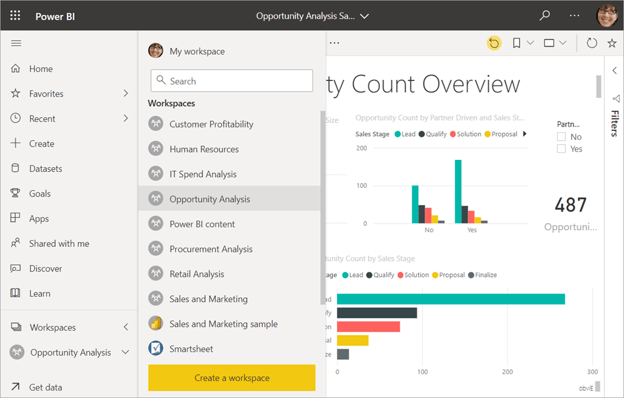
You can share your dashboards and reports with others, both within your organization and externally, ensuring that everyone has access to the latest marketing insights. Power BI also offers real-time collaboration capabilities, allowing multiple users to work on the same report simultaneously, facilitating a collaborative and data-driven approach to decision-making.


Source: Microsoft Power BI
Conclusion
We've explored the transformative potential of Power BI for revolutionizing your marketing analytics. With its intuitive interface, powerful data integration capabilities, and interactive visualizations, Power BI empowers marketers to uncover valuable insights, make data-driven decisions, and drive business growth.
So, strap yourself in and get ready to unleash the full potential of Power BI as we embark on a journey to revolutionize your marketing analytics game.
Not sure where to start? RevX expert marketing ops team can help integrate Power BI with your martech stack and set it up for success.
 Dashboards and analytics


.webp)


