HubSpot
 Salesforce
.png?width=58&height=58&name=Frame%202087327944%20(1).png) GA4
GA4
.png?width=58&height=58&name=Frame%202087327944%20(2).png) Marketo
Marketo
.png?width=58&height=58&name=Frame%202087327944%20(3).png) Audit Fox
Audit Fox

.png?width=815&height=457&name=resized_image_915x514%20(6).png)
Everyone loves dashboards. They look beautiful, colorful, and “data-driven.” However, they’re great historians and sub-par fortune tellers.
Dashboards tell you what happened after it already did. Decision intelligence tells you what will happen next, and crucially indicates what to do about it.
Many companies stop at the first stage. They do track open deals, conversion rates, CAC, and MRR on tidy dashboards. But when the quarter ends, the numbers don’t add up.
Because knowing what happened doesn’t help you change what’s coming.
Revenue leaders need predictive visibility more than prettier charts. They need systems that warn them when deals are stalling, the pipeline is thinning, or revenue is at risk before it shows up in the numbers.
And that difference can decide whether your next quarter is a celebration or a post-mortem
The dashboard trap and why visibility alone isn’t enough
Dashboards are like rearview mirrors, great for knowing where you’ve been, but lack utility for steering where you’re going.
They make us feel in control. Rows of KPIs, glowing charts, and trend lines that look like the heartbeat of your revenue engine. Except most of them are flatlining, quietly.
The problem is direction, not data!
And that’s how most revenue teams end up mistaking visibility for foresight.
You can have a full suite of dashboards, pipeline coverage, MQL volume, win rates, CAC trends, and still get blindsided by a bad quarter. Ever wonder why?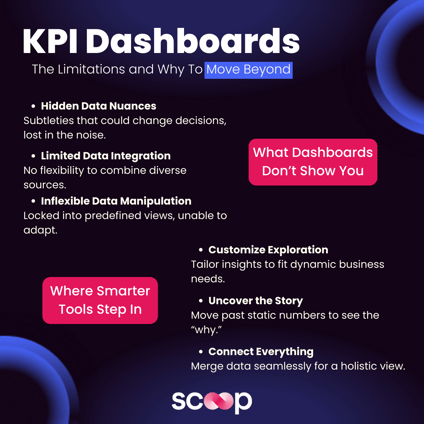
Source: Scoop
Traditional dashboards lack the real-time detection and response needed to act before anomalies affect the bottom line.
With Gartner estimating that downtime costs businesses over $300K per hour, enterprises can no longer afford to react; they need proactive system management.
Because these dashboards report lagging indicators. By the time they flash red, the damage is already done.
Think about it:
-
You’re tracking opportunities but not deal velocity.
-
You know conversion rates but not the probability of conversion.
-
You’re celebrating pipeline growth while deal quality quietly decays.
Dashboards make you look busy, not better. They’re designed for reporting, not predicting.
And that’s the trap that gives a false sense of control, hiding operational blind spots. The true revenue visibility is about having the right signals, the ones that warn you before the quarter goes sideways.
Because in RevOps, reacting to data is a lag, anticipating it is a moat.

Key takeaways:
- Lagging indicators (like MQLs or total pipeline) can’t warn you of performance decay.
- Visibility ≠ foresight; predictive systems are what separate proactive teams from reactive ones.
From descriptive to predictive Revenue Ops
We see many companies treat revenue analysis like an autopsy that’s insightful, but often too late.
Decision Intelligence is the change they need. It’s about predicting what’s likely to go wrong next and fixing it before the damage shows up in your CRM.
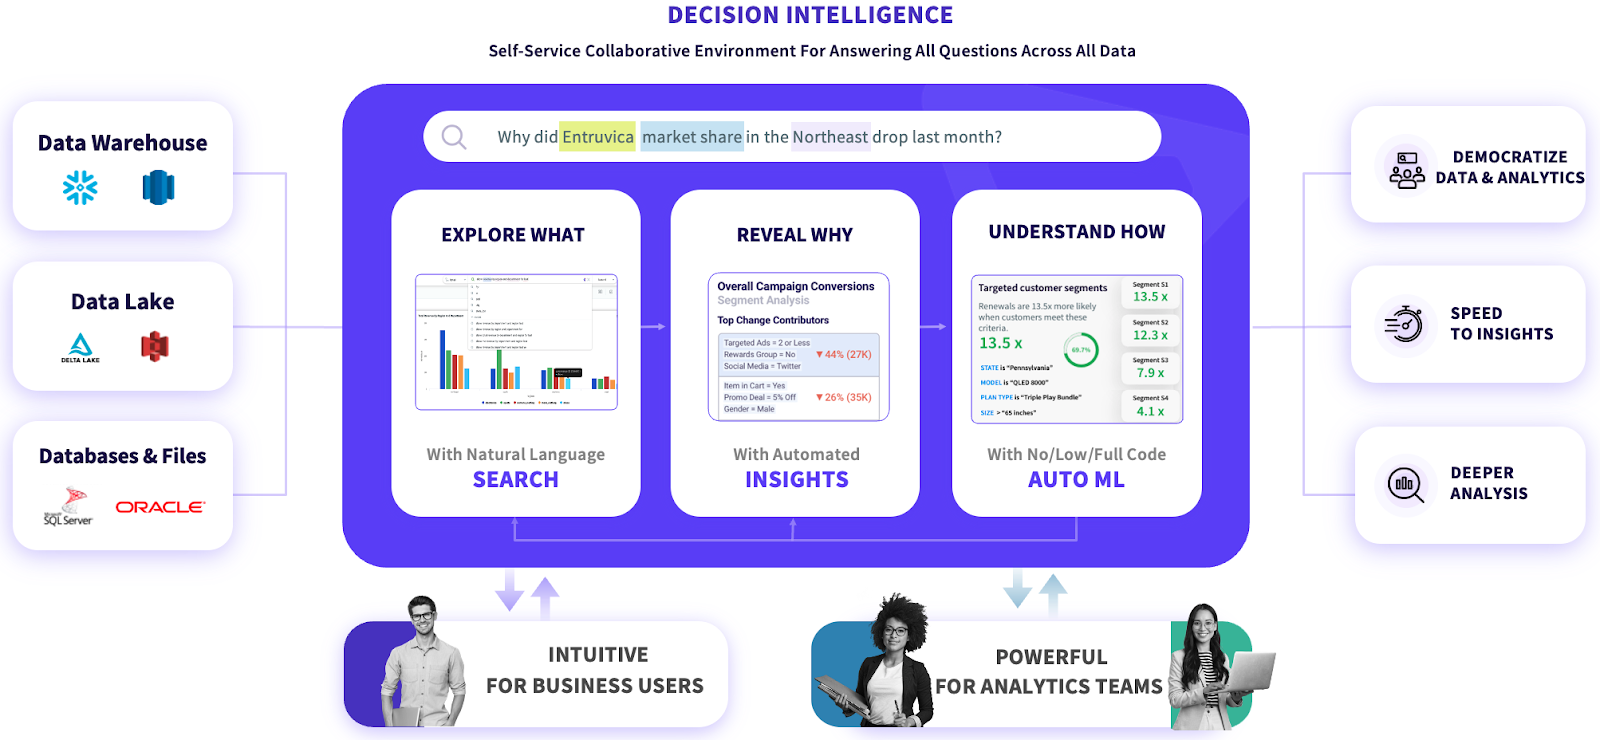
Source: Tellius
And then connecting data, context, and intent to turn static reports into dynamic foresight.
Think of it like this:
- Suppose a dashboard indicates that conversions dropped by 12%.
- Decision intelligence tells you it’ll drop another 5% next month unless you fix stage 2 velocity.
- And it’ll even suggest which rep, region, or campaign is pulling the average down.
Rather than a magic pill, it’s just math, modeled right.
Decision intelligence layers AI, machine learning, and RevOps context on top of raw data to identify patterns, probabilities, and pressure points.
Predictive revenue visibility tells you what to fix first. Because not every leak deserves the same bucket. That’s how RevOps evolves from a reporting team to a strategic command center.
Key takeaways:
- Decision intelligence turns descriptive analytics into predictive foresight.
- It links context with data to prioritize actions, not just observations.
- The future of RevOps is smarter anticipation.
Predictive Visibility and seeing revenue before it happens
Imagine if your dashboard didn’t just say, “You missed your target,” but whispered, “You’re about to miss it, here’s why.” That’s predictive visibility.
💡Learn how predictive analytics is reshaping Marketing Ops for scalable growth
While dashboards answer “what happened?”, predictive visibility answers:
- Which deals are real and which are noise
- Where pipeline risk is hiding
- How this quarter’s activity shapes next quarter’s revenue
- When reps are about to fall short, and why
RevOps leaders obsessed with this level of foresight are just running simulations.
They use models that learn from past performance, conversion probability, average deal velocity, buying signals, and rep behavior. And turn them into forward-looking insights that say, “Here’s what’s about to happen if nothing changes.”
That’s a game-changer simply because when you know why you’ll win or lose, you can change the ending.
And that’s the point: data is supposed to inform and expedite your decision-making process.
💡Here’s how to leverage Pardot's predictive analytics for improved conversions
Key takeaways:
- Predictive visibility lets you fix issues before they appear in reports.
- It transforms RevOps from a report-driven to an action-driven approach.
- Knowing what’s likely to happen is more valuable than knowing what did happen.
From dashboards to decisions: Making revenue data actually work for you
When your systems talk to each other, be it CRM, marketing automation, forecasting, and finance, you move from static reports to dynamic guidance. The goal is no longer confined to just visibility and encompasses predictive adaptability.

Here’s what that looks like in practice:
- Close the loop: Build bi-directional data flow between pipeline sources and revenue outcomes. When attribution data feeds forecasting, every dollar has a story.
💡Discover how to leverage demand forecasting to boost the bottom line
- Add feedback layers: Don’t just display metrics, flag anomalies, surface opportunities, and recommend next actions automatically.
- Empower interpretation: Use AI and RevOps alignment to translate data into cross-functional clarity, not departmental confusion.
Teams that master decision intelligence shape what happens next.
Key takeaway: Revenue visibility is about designing systems that think with you.
Bottom line: Most teams obsess over making data visible while the best ones make it decisive. Because the future of RevOps will belong to those whose systems can think, adapt, and decide before humans even ask the question.
The real question is, when your next quarter depends on prediction, will you trust your reports… or your foresight?